The Chart-of-the-Day features two charts. First is a look at the various U.S. market sectors and how they have performed since the S&P 500 Index reached the 2000 mark five years ago. The second chart looks at individual companies that are the “winners” and “losers” over that time-span.
You can access the Chart-of-the-Day report at the following link: … DayChart_071119_RGMP
Bob Weir has over 50 years of investment research and analytical experience in both the equity and fixed-income sectors, and in the commercial real estate industry. He joined eResearch in 2004 and was its President, CEO, and Managing Director, Research Services until December 2018. Prior to joining eResearch, Bob was at Dominion Bond Rating Service (DBRS).
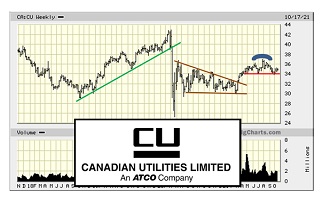
Since April 2020, CU has been trading in an extensive rectangle between $30 and $37. One year later, in April 2021, the stock began its assault on its upper parameter, but the stock failed to overcome resistance at $37. It seems that some kind of catalyst is needed to get CU “over the hump”. [more]
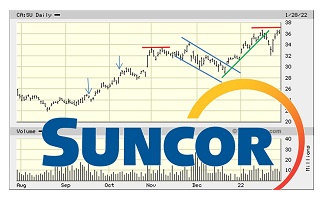
The Energy sector and its associated companies and their stocks seem likely to continue to outperform despite increasing economic and market headwinds. [more]